Dashboard
The Apiary dashboard is a terminal app for watching your hive work in real time — which tasks are running, how your agents are performing, and what the dispatcher is doing right now.
Before you start
The dashboard shows data produced by a running dispatcher. In a typical setup you have two terminals:
apiary run is headless — it does not draw anything itself, it just works in
the background and writes everything to the data store. apiary dashboard is
the window you open to watch it.
If you open the dashboard before the dispatcher has ever run, it will tell you
no data is available yet. Start apiary run and the dashboard will fill in on
its next refresh.
The dashboard only ever reads — you can open and close it as often as you like without affecting running tasks.
Where the data lives. Apiary is project-scoped: its state sits in a
.apiary/folder next to your config file — the database at.apiary/apiary.db, logs under.apiary/logs/, and IPC socket at.apiary/apiary.sock.Config file lookup order.
apiarylooks for the config file in two places (in order): 1.apiary.yamlin the current directory 2..apiary/apiary.yamlin the current directoryThis lets you keep everything tidy inside
.apiary/:.apiary/ apiary.yaml ← your config (optional here) apiary.db ← SQLite database (auto-created) apiary.sock ← IPC socket (auto-created) logs/ ← log files (auto-created) apiary.yaml ← your config (default location)Run
apiary dashboardfrom the same directory asapiary run(or point both at the same config with--config) so they share the same project data.
Getting around
The dashboard has four tabs along the top. Use the keyboard to move:
| Key | Action |
|---|---|
← / → |
Switch between tabs |
Tab / Shift+Tab |
Next / previous tab |
↑ / ↓ |
Move the selection or scroll within a tab |
Home / End |
Jump to top / bottom |
PgUp / PgDn |
Page up / down |
Ctrl+U / Ctrl+D / Space |
Alternative page up / down |
r |
Refresh now |
q / Ctrl+C |
Quit |
The active tab refreshes on its own every couple of seconds. The footer shows how long ago the data was last loaded, so you always know how fresh it is. Contextual help in the footer shows which keys are available in the current view.
The tabs
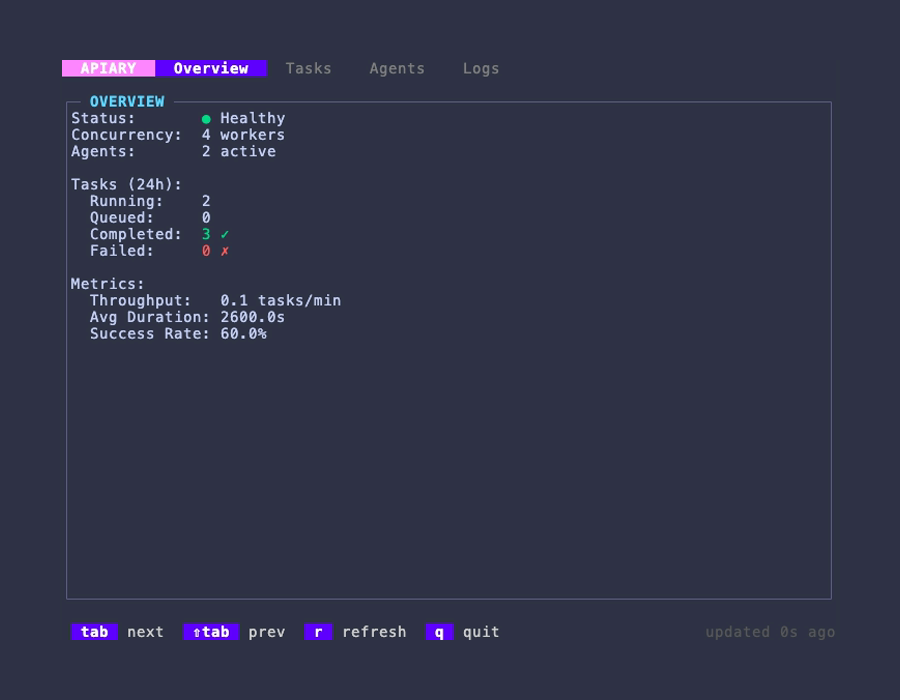
Overview
Your at-a-glance health check. Use this tab to answer "is everything moving?"
- Status — dispatcher health indicator (Healthy / Degraded / Unknown) with a live glyph.
- Uptime — how long the dispatcher has been running.
- Concurrency — worker pool size (configured in
apiary.yaml). - Active Agents — agents that have processed work in the last hour.
- Running — how many tasks are being worked on this instant.
- Queued — tasks that failed and are waiting to be retried automatically.
- Completed / Failed — how much work finished today, and how much didn't.
- Success Rate — the share of today's work that succeeded. A sudden drop is your cue to check the Logs tab.
- Avg Duration and Throughput — how long tasks take and how fast they're clearing, so you can spot slowdowns.
Counts like Completed, Failed, Success Rate and Avg Duration cover today (since midnight) and reset each day. Running and Queued are live right-now numbers.
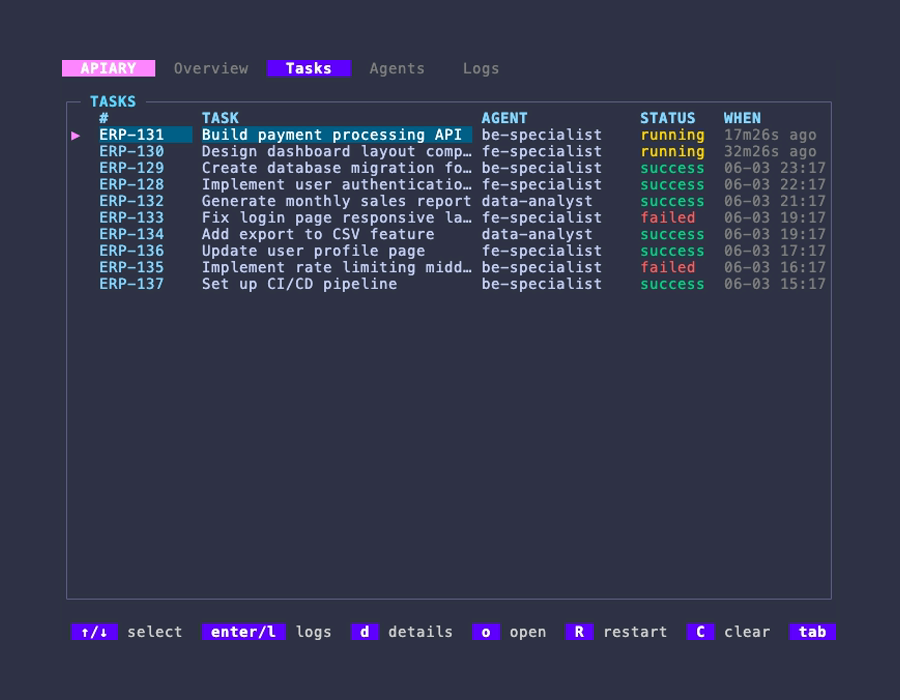
Tasks
A list of recent tasks — both running and already finished — newest first. Each
row shows the task title, the agent that handled it, its status (running /
success / failed), and when it ran. Use ↑ / ↓ to move the ▶ marker.
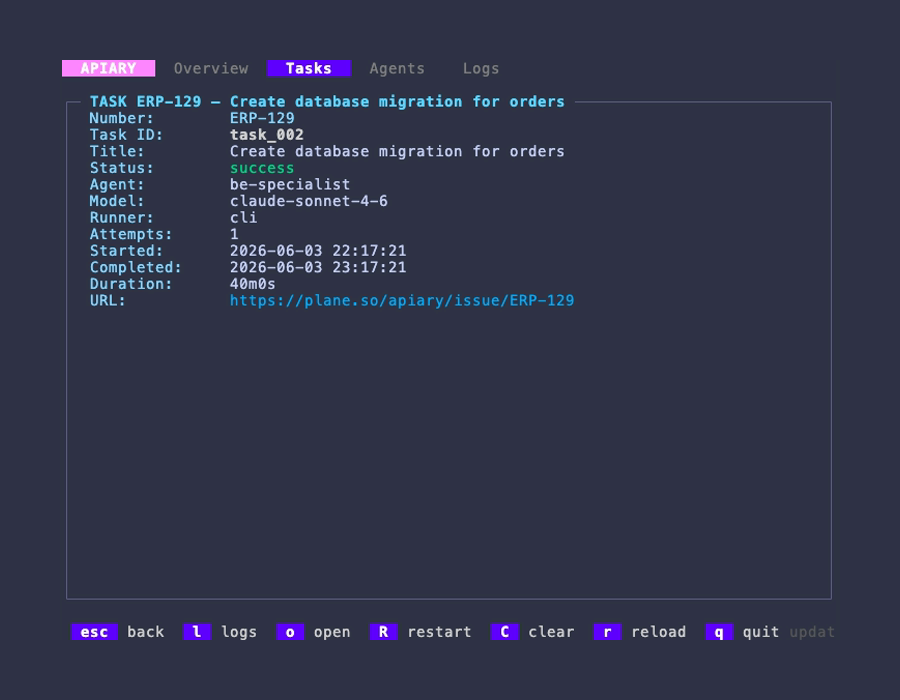
From the list you can drill into the selected task:
| Key | Opens |
|---|---|
d |
Details — agent, model, runner, attempts, start/finish times, total duration, and the error message if it failed |
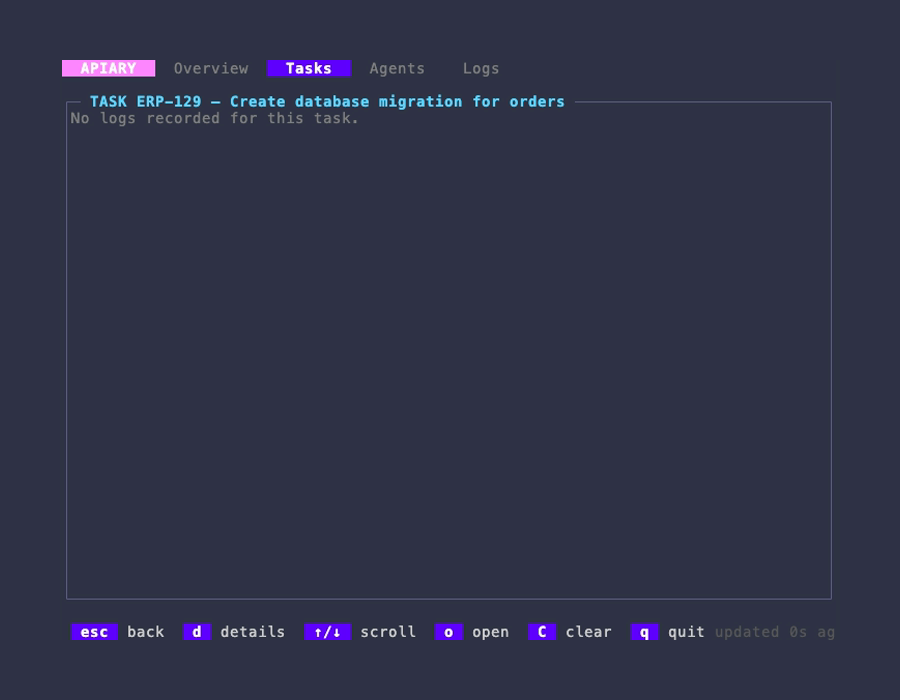
Enter or l |
Logs — the per-task log lines for that run |
o |
Open the task in your browser (its source URL) |
R (Shift+R) |
Force restart — cancel and re-dispatch the task (with confirmation) |
C |
Clear logs — delete all logs for the task (with confirmation) |
Esc / Backspace / h / ← |
Back to the list |
The # column shows each task's human reference (e.g. ERP-42) so you can
match a row to the work item in Plane. Press o on any task — in the list, in
Details, or drilled into from an agent — to open it directly in the browser.
In the Logs view, ↑ / ↓ scroll through the lines, Home / End jump
to the top / bottom, and PgUp / PgDn (or Ctrl+U / Ctrl+D / Space)
scroll a page at a time. From either sub-view you can jump straight to the
other (d ↔ l) or press r to reload it.
Running tasks show how long they've been going; finished tasks show when they completed. A task that was retried shows its attempt count in the Details view.
Force restart and clear logs
Pressing R (Shift+R) on a selected task shows a centered confirmation
modal with a rounded border. Press y / Y to confirm or any other key to
cancel. This sends a restart request to the daemon via Unix socket —
the task's running dispatch is cancelled and its state is reset to todo for
re-dispatch on the next cycle.
Pressing C on a selected task works the same way — confirm with y / Y
to delete the task's logs and execution records, or any other key to cancel.
Watching the live conversation (debug mode)
By default the per-task Logs show the milestones: the dispatch decision, the agent's final output, and whether it succeeded. To watch the full, real-time conversation with the agent — every message, tool call, and result, plus the exact prompt that was sent and the routing decision that picked the agent — start the dispatcher in debug mode:
With --debug, each task's Logs view fills in live as the agent works (the
dashboard refreshes every couple of seconds). You'll see, in order:
- the routing decision — which route matched, which were skipped and why, and the agent that was selected;
- the prompt — the exact text sent to the agent (task title, description, labels, and the agent's soul file);
- the conversation —
[assistant]messages,[tool→ …]calls with their inputs,[tool← result]outputs, and a final[result:…]line with turns, duration, and cost.
These are DEBUG-level lines (shown in grey). Without --debug they are not
recorded, keeping normal runs lightweight.
The rich [assistant] / [tool→ …] breakdown comes from Claude's structured
event stream — the claude provider preset already requests it
(--output-format stream-json --verbose), so a plain runner is enough:
Apiary parses those events into the readable lines above. A CLI without structured output still streams — you just see its raw output instead.
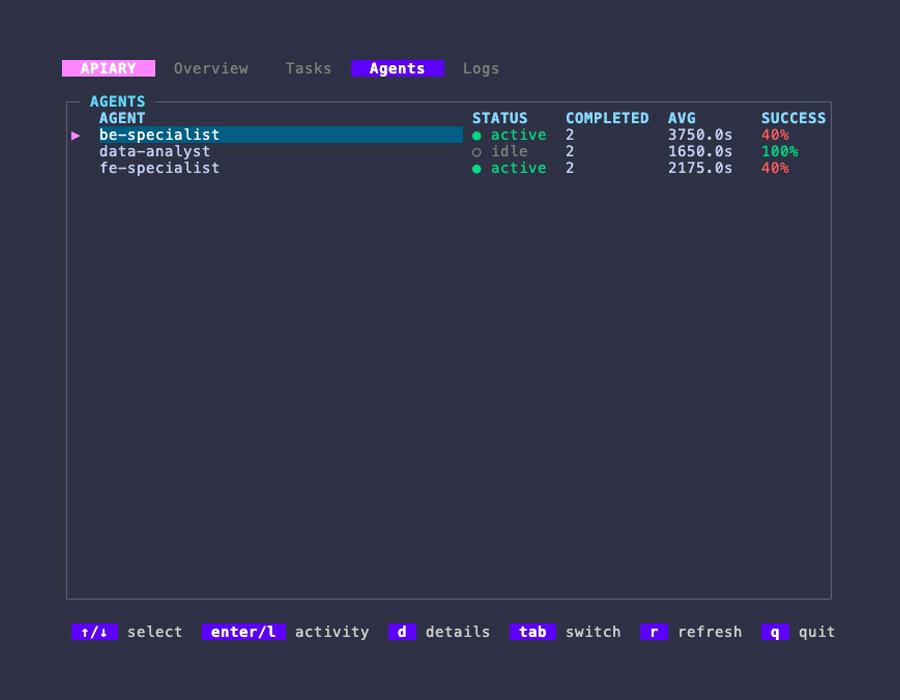
Agents
How each of your agents is performing over time. For every agent you'll see its status (active / idle), completed task count, average run time, and overall success rate (color-coded).
Use this tab to compare agents — to spot one that's failing more often than the others, or one that's much slower — so you can adjust which work you route to it.
An agent shows up here once it has actually run at least one task.
The Agents tab supports three levels of drill-down:
| Key | Action |
|---|---|
d |
Detail — full per-agent stats: status, running count, current task, completed / succeeded / failed counts, queued count, success rate, average duration, last task timestamp |
Enter / l |
Activity list — all tasks handled by this agent (from activity: press Enter / l again to drill into that task's logs) |
o |
Open the task's source URL in your browser (from activity or task logs) |
Esc / Backspace / h / ← |
Back one level (agent list → detail → activity → task logs) |
Home / End |
Jump to top / bottom in activity list or task logs |
PgUp / PgDn |
Page up / down in activity list or task logs |
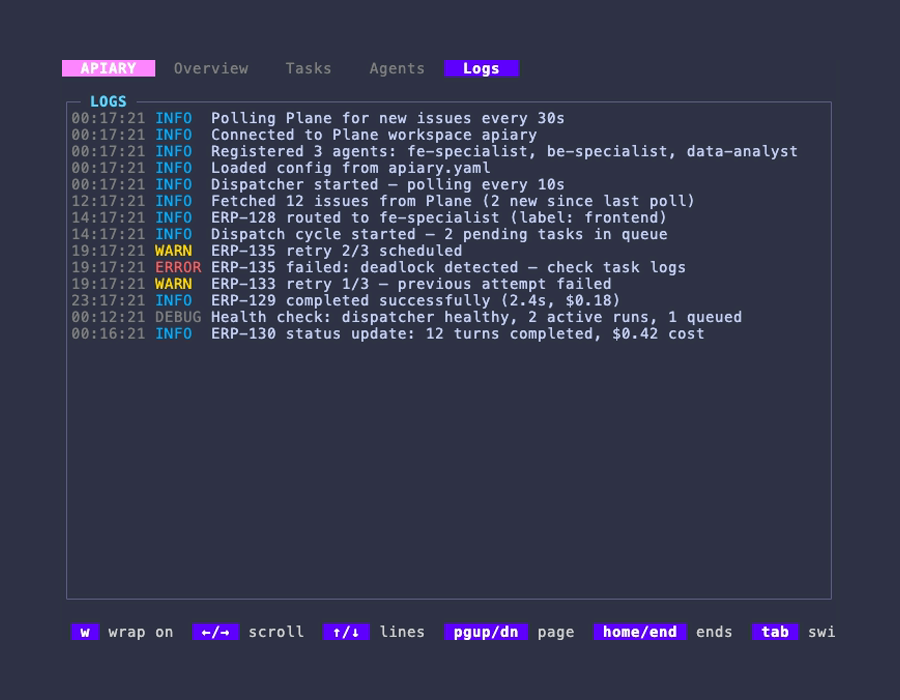
Logs
A live feed of what the dispatcher, router, and runners are doing, newest at the bottom. Lines are color-coded so problems stand out:
- Red — errors
- Yellow — warnings
- Blue — informational
- Grey — debug / verbose
Use ↑ / ↓ to scroll back through recent activity. Home / End jump to
the start / end, and PgUp / PgDn (or Ctrl+U / Ctrl+D / Space) scroll
a page at a time.
| Key | Action |
|---|---|
w |
Toggle word wrap — when on (default), long messages wrap. When off, ← / → scroll horizontally by 8 columns |
← / → |
Horizontal scroll — only when wrap is off |
r |
Refresh now |
The footer shows your scroll position (e.g. line 42/150) so you always know
where you are. This is the first place to look when the Overview tab shows
failures.
Troubleshooting
The dashboard says there's no data / a tab looks empty.
The dispatcher hasn't produced that kind of data yet. Make sure apiary run is
going in another terminal, then give it a task to work on. The Overview and
Agents tabs populate first as soon as work starts; the Tasks and Logs tabs fill
in as the dispatcher records running tasks and log activity.
Numbers look stale.
Press r to force an immediate refresh. The footer shows the last update time.
The dashboard won't open.
It needs the dispatcher's data store, which is created the first time you run
apiary run. Run the dispatcher once, then reopen the dashboard.
I want to quit.
Press q (or Ctrl+C).